Problem
The RediGate does not seem to accepting the parameters of the latest configuration that was loaded.
Possible Causes
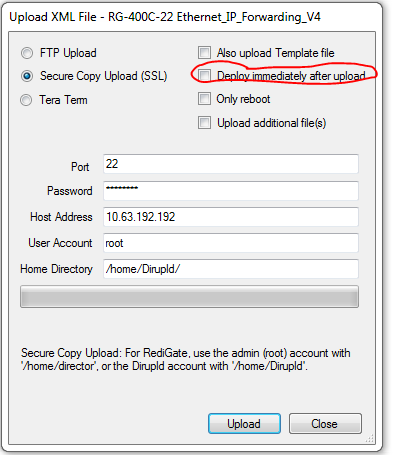
If you downloaded a configuration to the RediGate and left the "Deploy Immediately" button unchecked, you will need to power cycle the RediGate or manually run the "reconfigure" command in order for the RediGate to deploy the downloaded configuration. If you fail to deploy the uploaded configuration prior to download a new configuration, you will end up with multiple configurations in the RediGate's /home/director or /home/Dirupld directories. The RediGate expects only one configuration to be in either of these directories when it is rebooted or reconfigured, so having multiple configurations in a directory causes the RediGate to ignore the new uploaded configurations and keep its current configuration. If this occurs, the RediGate will log the error to the "Problem.txt" file.
Symptoms
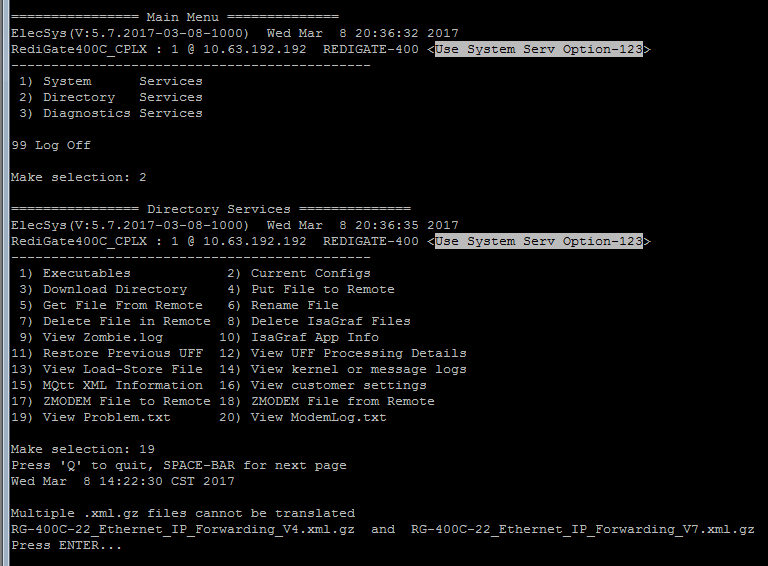
- Problem.txt file information shows the following error:Problem.txt File
Multiple .xml.gz files cannot be translated
RG-400C-22_Ethernet_IP_Forwarding_V4.xml.gz  and  RG-400C-22_Ethernet_IP_Forwarding_V7.xml.gz
Press ENTER...
- If there are 2 .xml.gz's (not including .run)
- If there are 2 .uff's (not including .run)
- The name of the configuration on the RediGate does not match the name of the last configuration that was downloaded to it
Possible Causes
- A configuration already exists on the RediGate, and the
Solutions
- Check to see that the name of the configuration matches
Viewing the MQTT Status
- In the RediGate command-line session, select "3" (for Diagnostic Services) and then "17" (for MQTT Status):
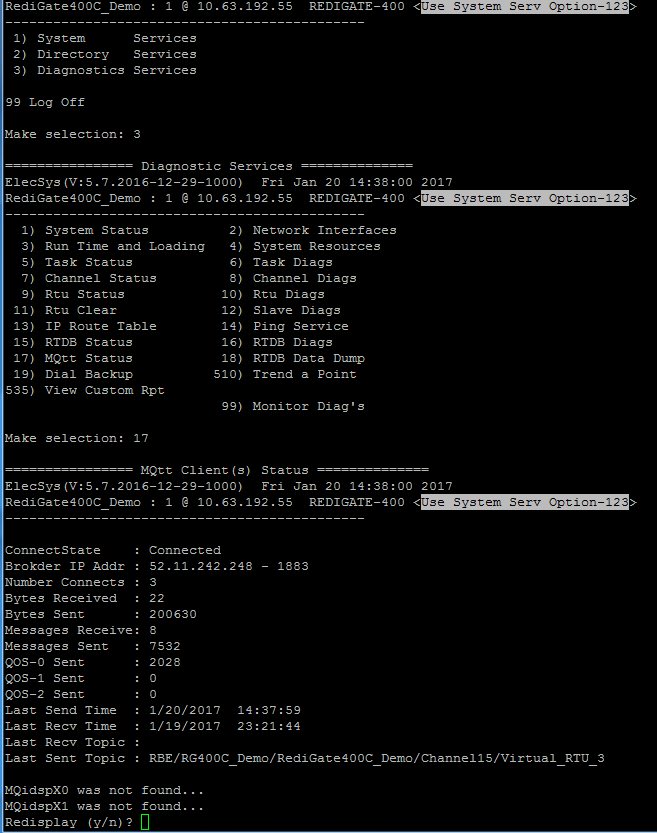
- Here you will see various diagnostic information about the current connectivity status of the RediGate
Viewing the MQTT Diagnostics
- If you need more detailed information about the status of the MQTT client, you can enable diagnostics by entering options 3, 6, 3, 4:
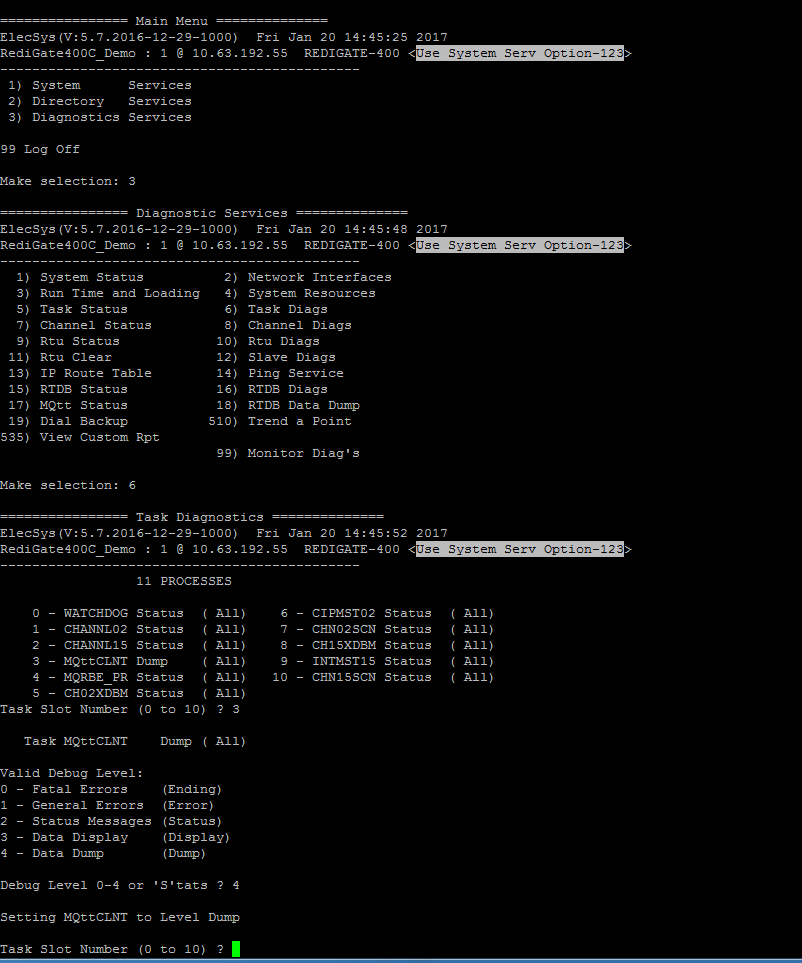
- After entering those values, press <enter> a few times to get back to the main menu, and then enter options 3, 99, y, <enter>
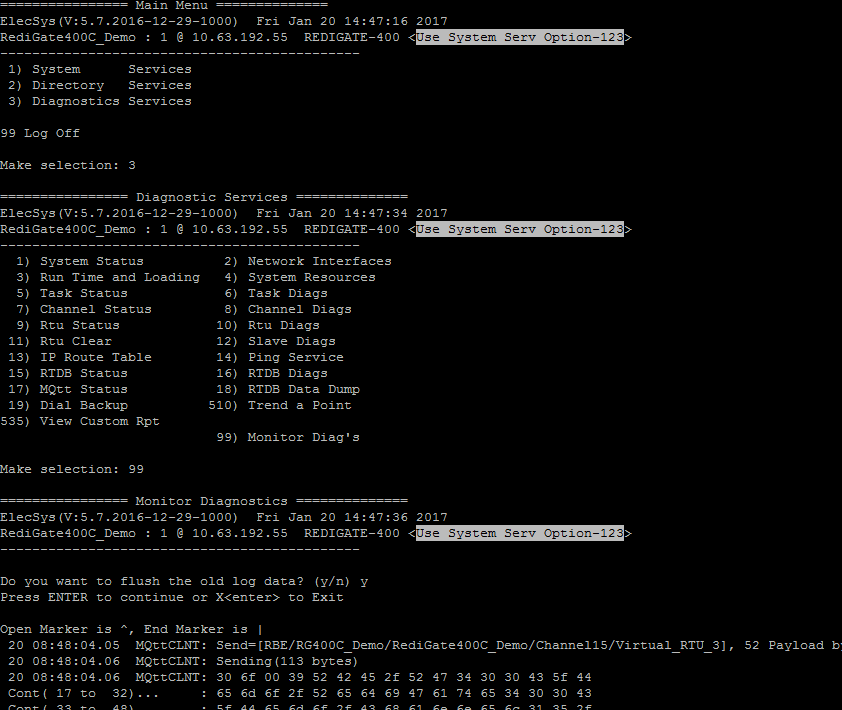
- The terminal will output all of the diagnostics data from MQTT client task. You can enable/disable other task diagnostics be following step 1 and entering option 3, 6, (task number of interest), 4. Press <enter> to pause the flow of the diagnostics data, and "X" to exit.